We’ve all heard it before: A grandparent telling their grandchild to “get off of that skateboard before you break a bone!” which is usually met with a dramatic eye-roll.
Whether it’s that youthful feeling of invincibility or purchasing a life-insurance policy to mitigate risk later in life, it’s clear that everyone’s sense of risk-taking is subjective. It seems that as most people get older and more experienced, they gradually take fewer risks and exercise caution as they make their way through the world.
At Coventry, we believe that a life worth living is also worth protecting. However, we also know that many Americans are tied up in life insurance policies with more coverage than they need. With that in mind, we wanted to find out how risk-tolerant Americans actually are and how people respond to various risks. To answer these questions, we went right to the source.
We surveyed 3,750 Americans, including at least 75 respondents per state. We asked them to rate their risk tolerance on a scale of 1-4, with 1 being the least risky and 4 being the riskiest. We also inquired about how likely they would be to take on specific risks varying from physical to financial.
So which states stay cool as a cucumber and which states run like the Roadrunner in the opposite direction? Read on to find out.
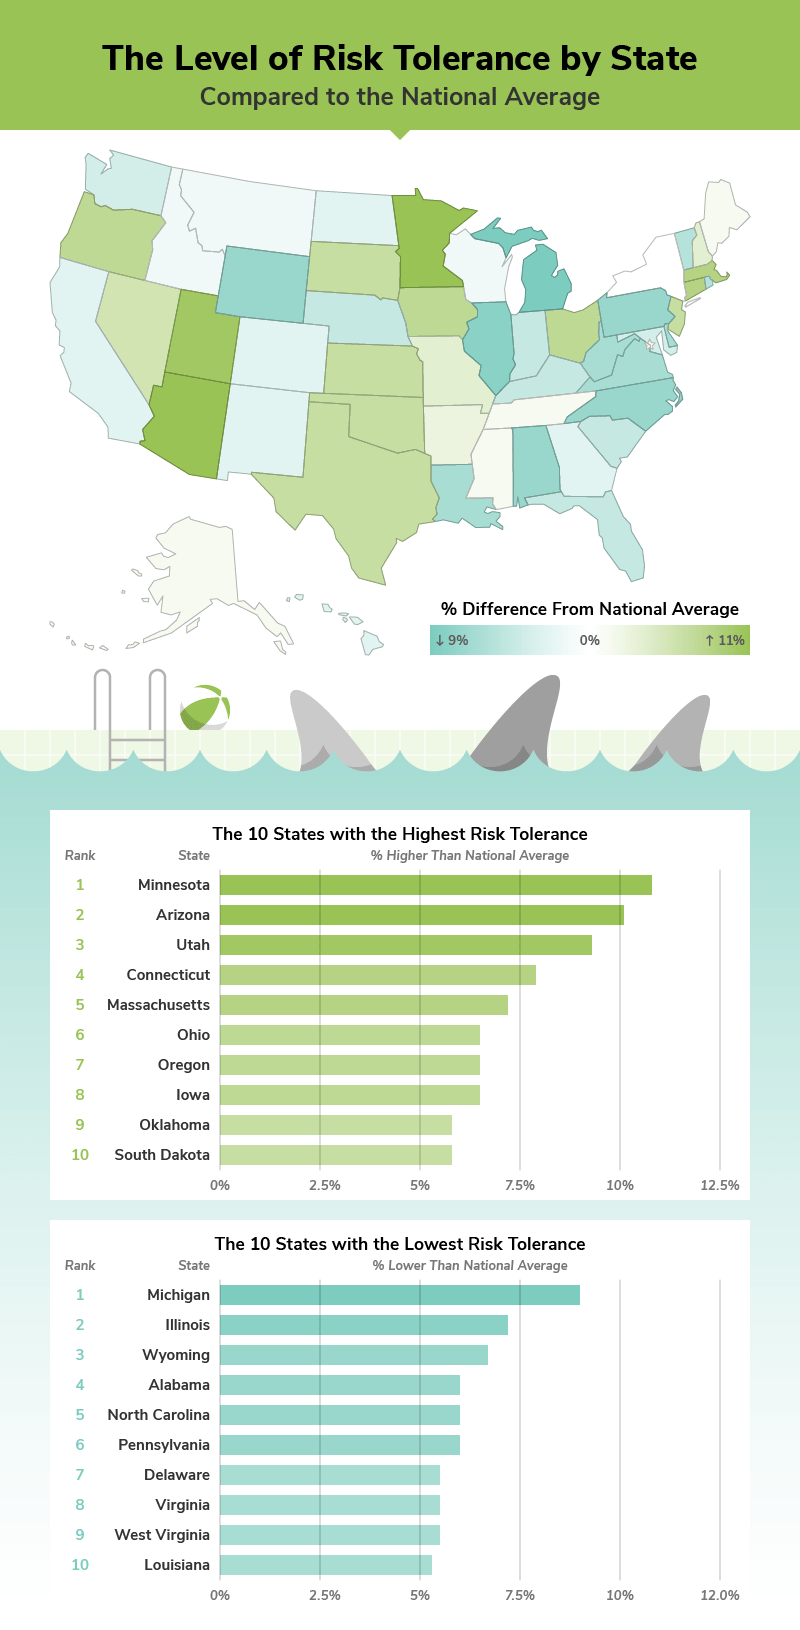
Out of all states, Minnesota claims to be the riskiest state, with a risk tolerance score of 1.72 or 10.8% higher than the national average. Minnesota is also joined by its Midwestern neighbors Ohio, Iowa, and South Dakota in the top 10 states with the highest risk tolerance. In fact, the Midwest sits at 1.1% above the national average as a whole.
We’re not sure if it’s braving icy cold winters, traversing icy roads, or knowing that every conversation might be dragged out by endless niceties, but Midwesterners sure can handle their risk. Or can they?
Interestingly, three Midwestern states didn’t get the memo and consider themselves to be the least risk-tolerant in the nation. Michigan, Illinois, and Wyoming came in at 9%, 7.2%, and 6.7% below the national average, respectively.
However, the majority of America’s 10 least risk-tolerant states are in the South. In fact, Southern states hog half of the top 10 positions for lowest risk tolerance, leaving only two spots for Pennsylvania and West Virginia.
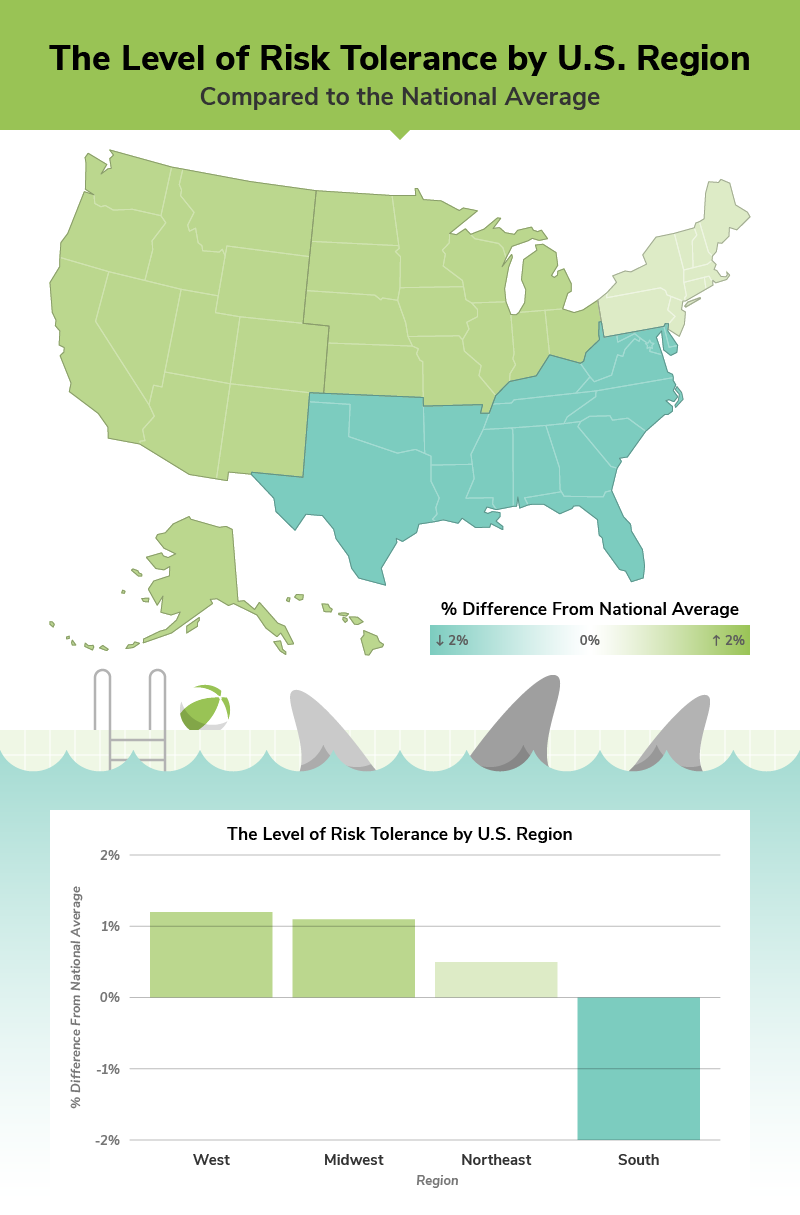
Furthermore, the South was the ONLY region to trend to the safe side, coming in at a full 2% below the national average of risk tolerance and more than 3% lower than the riskiest region. The other three regions skewed in the opposite direction with the West at 1.2%, the Midwest at 1.1%, and the Northeast at 0.5% above the national average.
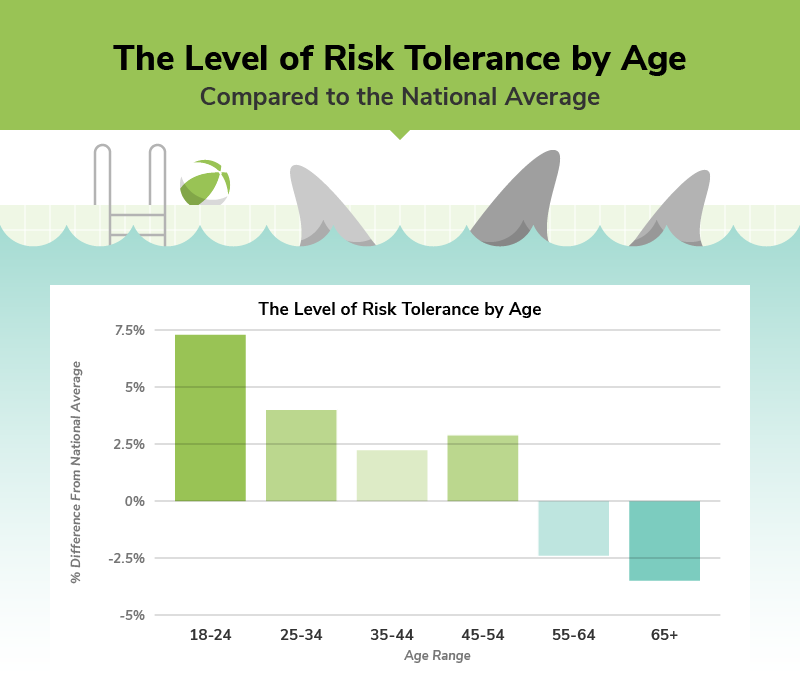
We got no surprises when it comes to age, but our data does validate worried grandpas everywhere who are pleading for their younger, springier loved ones to get off those darned skateboards. Gen Z was the riskiest generation by far, with an average risk tolerance 7.3% higher than the national average.
The opposite, then, is true of Boomers and The Silent Generation, which were 2.4% and 3.5% less tolerant of risk than the national average. It makes sense that the longer we live and the more we experience, the greater our internal need to protect what we have grown and accomplished over all those years, in turn protecting our loved ones who follow in our footsteps.
We also asked respondents to rate how likely they were to take specific risks and were met with some shocking and even comical results.
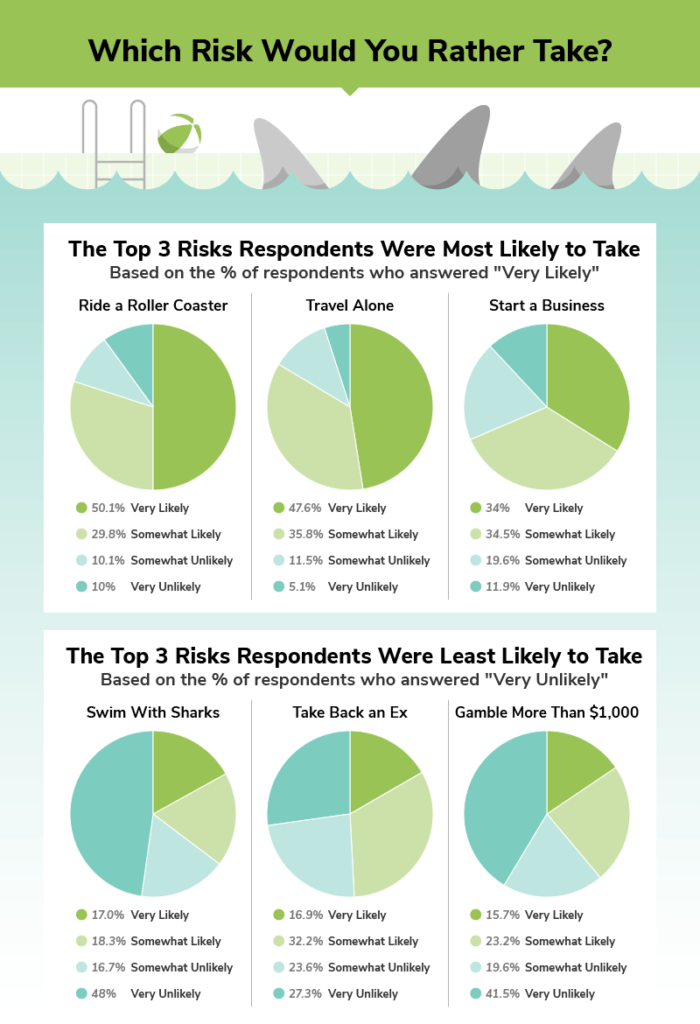
Respondents barely batted an eyelash at riding a roller coaster, with 50% being very likely to trust the rails and take the plunge. Similarly, 47.6% of respondents claimed to be very likely to travel alone. Yet the third risk that Americans are most likely to take was less of a given. A modest 34% of respondents said they were very likely to start a business.
And we don’t blame them. While the potential satisfaction of building a company from the ground up is far greater than the immediate gratification of amusement park rides, the number of ways it could go wrong, both financially and emotionally, also spike dramatically.
Things get really interesting when we look at the risks respondents were least likely to take. Respondents claimed that they were more likely to swim with sharks (17% very likely) than take back an ex (16.9% very likely)! Sure, a 0.1% difference is splitting hairs, but we still don’t want to know what sort of romantic entanglement is comparable to facing off with a shark!
Even more surprising, respondents were even less committed to gambling more than $1,000, with only 15.7% of respondents very likely to do so. Apparently, the risk of losing that cold, hard cash is a more difficult thought to bear than the potentially disastrous hospital bills after a shark chomp.
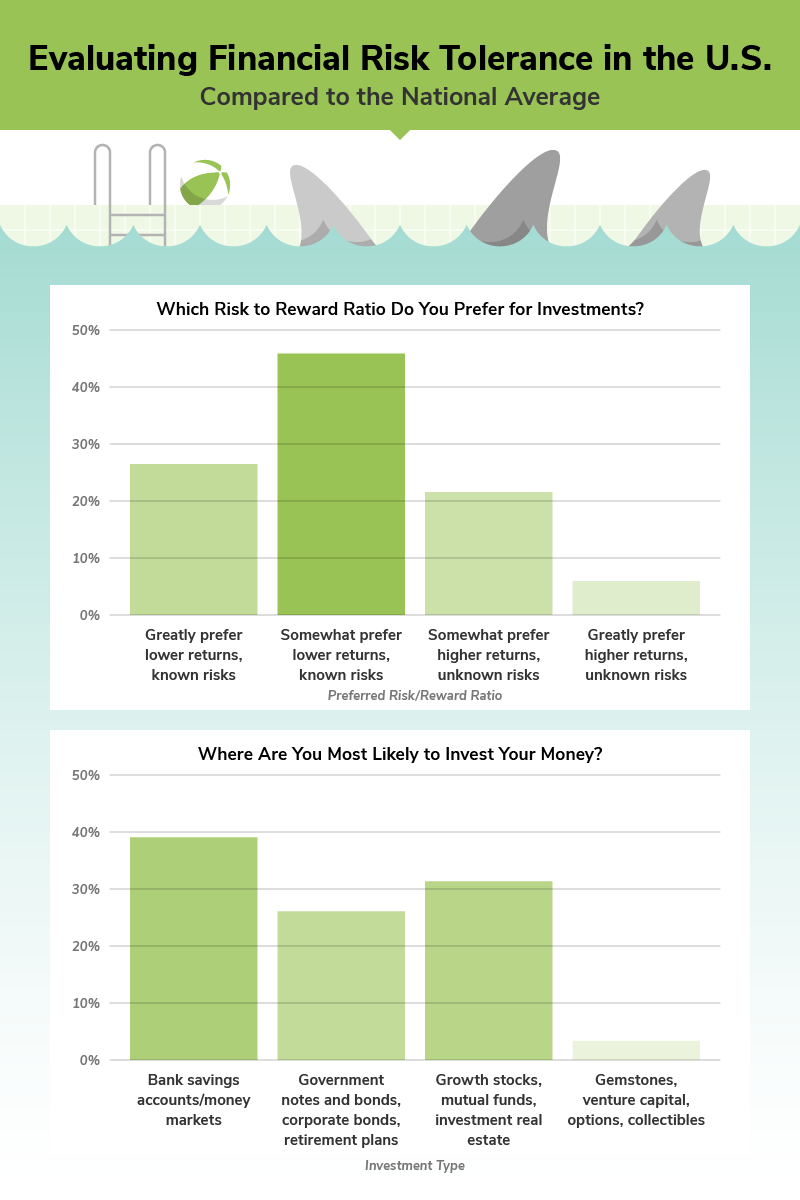
All jokes aside, we dove deeper into Americans investing and financial risk habits, a topic we care deeply about. Far and away, Americans prefer to play it safe with their hard-earned money. When asked about investing strategies, 26% of respondents said they greatly prefer lower returns with known risks, while 46% somewhat prefer the same. On the other side of the coin, just 21.6% somewhat prefer higher returns with unknown risks and a paltry 6% greatly prefer that investment strategy.
Of course, these findings are more nuanced depending on the demographic. For example, more women (73.8%) than men (71.3%) are somewhat or very likely to choose investment vehicles with lower returns and known risks.
As with all risks, age plays a role in our assessment of financial risk as well. Boomers were the most likely generation to prefer known risks with lower returns while Gen Z was the most likely to prefer unknown risks with the potential for greater rewards.
We also asked respondents about which investment vehicles they were most likely to keep their money in. Nearly 40% chose a bank savings account, which was the least risky and least rewarding of the options given. In fact, the national average interest rate on a bank savings account is a piddly 0.05% APY, not even coming close to keeping up with inflation. Unsurprisingly, this option also appealed most to women and Boomers, who have been established throughout our study as the least risk-tolerant demographic groups.
Every person is different when it comes to risk, and therefore is comfortable with different parameters when it comes to living their life and covering it with life insurance. If common sense isn’t keeping you from shark-infested waters, we’ll risk betting that no life insurance policy will either. So, whether your coverage overcompensates your risk tolerance level or you need access to tied-up funds, Coventry Direct is here to help you make life insurance more flexible, powerful, and valuable.