There’s only one drink that millions of people will consume, scalding hot or icy cold, no matter the temperature outside. For many enthusiasts, it’s one of the tastiest and most timeless drinks ever created. For other devotees, it’s lifesaving liquid energy. It even has shops dedicated to it in most cities, airports, and business hubs. You guessed it, we’re talking about coffee.
No one knows just how this bean from the duly named coffee plant was discovered to hold the solutions to all of Monday morning’s worst problems, but most legends call back to a farmer from Ethiopia who lived hundreds of years ago. The original beverage was created with just two ingredients, water and coffee beans, and the recipe remains the same for many Americans today.
However, coffee is largely customizable. In the modern day, sippers can add sugar and creamer with various flavors to turn this energizing elixir into a delicious drink. With so many variants and additives to choose from, we set out to discover how residents in different regions of the U.S. prefer their cup of coffee.
Methodology
To determine how every state takes its coffee, we surveyed over 2,100 Americans from 44 states over two weeks in October 2023. We asked respondents to choose their preferred coffee shade, how many cups they typically drink daily, and how late in the day they will drink coffee to map out coffee preferences across the country. We grouped similar shades into numbered categories on a spectrum with 1 being the lightest (with the most cream or sugar) and 9 being the darkest (a classic black coffee).
Mapping Out America’s Coffee Preferences
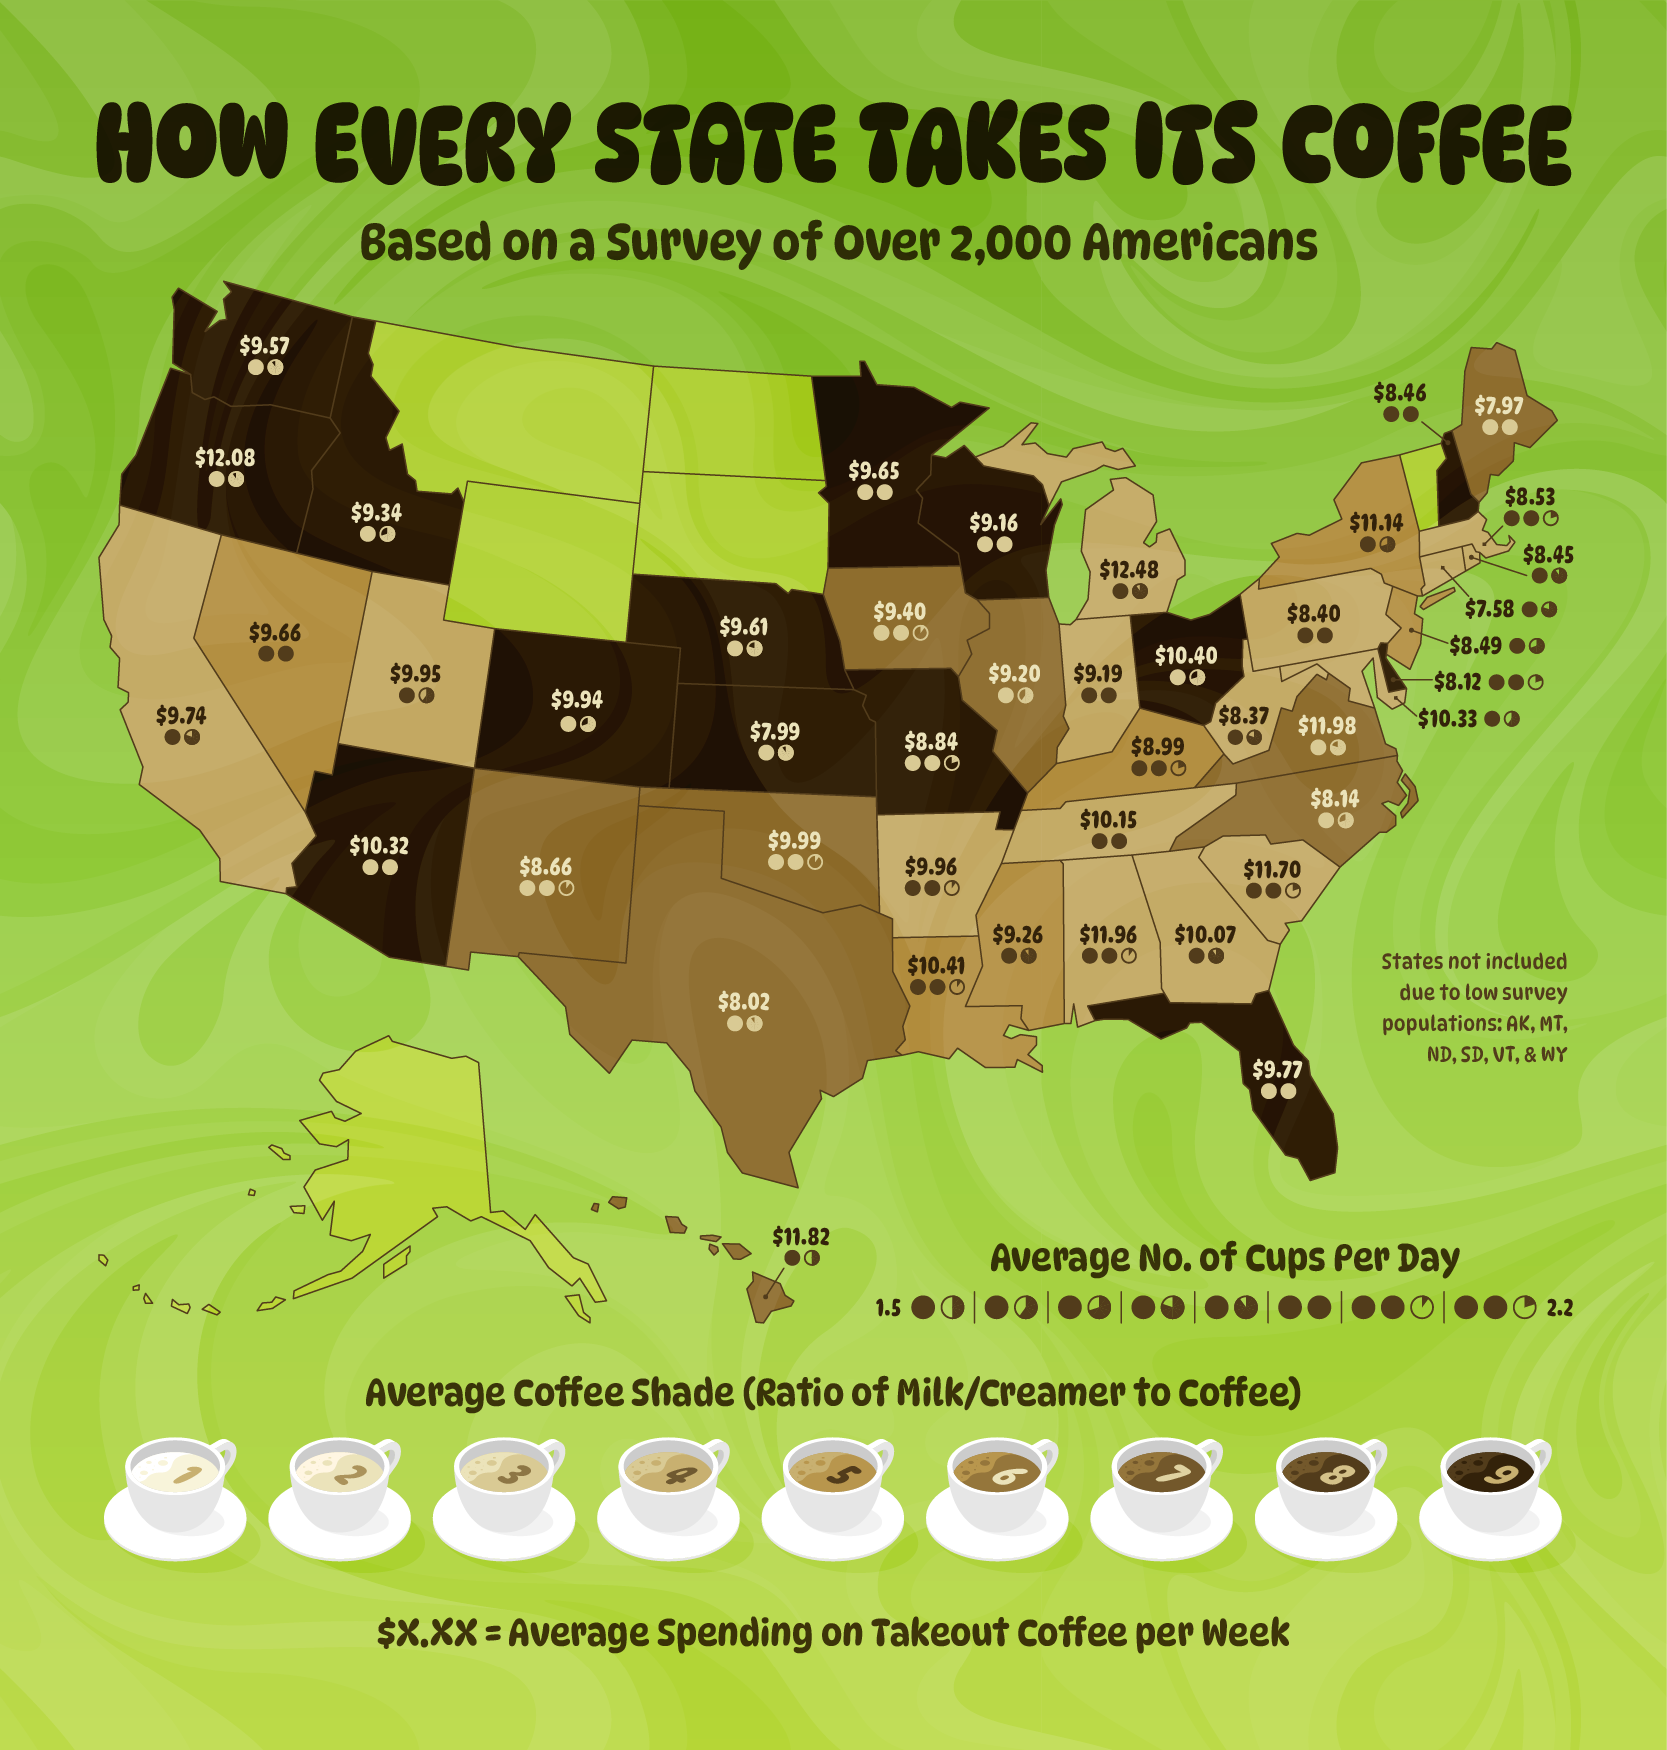
For many coffee lovers, one cup just isn’t enough. Nationally, Americans have an average of 1.9 cups of coffee a day. In Delaware, however, people drink more than any other state. Drinking 2.2 cups of coffee a day on average, they like their coffee black with an average shade of 9 (darkest in the study). Nonetheless, the residents of Delaware are open to adventure. They are the only state where the majority of respondents said they switch up their coffee orders regularly.
Averaging 2.2 cups of coffee daily, Missouri is just behind Delaware for the state with the most caffeine fiends. Missourians also prefer their coffee black with a shade of 9, but unlike other states, they’re not afraid to brew one well into the afternoon. People in Missouri will have a coffee at the latest in the day, answering that they’ll drink it as late as 3:36 p.m. on average. What a way to close out the workday! Let’s just hope they get some sleep.
People in Massachusetts also drink an average of 2.2 cups of coffee per day, tied for second most in the country. Diverting from the traditional black coffee, residents of the Bay State like a coffee color of 4 –– the lightest average shade in the study! This shade has a pale brown color to it, so it likely has a little more than just water and coffee beans. Do you want any coffee with that cream, Massachusetts? To their credit, 14 other states also prefer a shade of 4, making it the most popular shade by count of states. You’re not alone!
We also asked respondents to indicate how often they buy coffee out instead of brewing it at home, as well as how much they spend when they do. The average American who at least occasionally buys coffee out will go for it about twice per week and spend roughly $4.67 per cup. That means the average weekly cost of buying coffee out in the U.S. is $9.68. Delaware, Missouri, and Massachusetts each have an average weekly cost below $9.00. Maybe that’s why they drink so many cups!
In states like Michigan, however, the average weekly cost of buying brain juice is much pricier. Residents report spending an average of $12.48 a week, nearly $3 more than the national average. If you’re looking to get the perfect brew at home instead of going out, residents of the Great Lakes State prefer a coffee shade of 4 and about 1.9 cups a day.
With an average weekly cost of buying coffee out at $12.08, residents of Oregon save a few more coins a week than people in Michigan. Sipsters, short for Oregon’s sip hipsters, prefer their classic black coffee with a shade of 9, of course. They will also drink it well past midday, with an average late cutoff time of 3:02 p.m.
Virginia is for lovers, but maybe not coffee lovers. At $11.98 on average, the state is home to the 3rd highest weekly cost of buying coffee out. While it isn’t the priceiest average, sticking to their home coffee machine might save Virginians some money. Virginia’s shade preference is 6, grouping it into the list of less than a quarter of states whose ideal color is this middle-ground brown. Shade 6 is most likely the equivalent of a coffee with a splash of cream to add some flavor.
What Else is Brewing?
If you’re ready for a second cup, here are some more piping-hot insights from the survey:
- The most popular type of coffee in the U.S. is drip coffee (with cream and/or sugar) (32%), followed by lattes (16%), black drip coffee (14%), and cold brew (10%).
- Given the choice between the two, 62% of Americans would prefer hot coffee, while 37% would prefer iced, generally speaking.
- When choosing between the two, most Americans (60%) drink coffee more for the taste than the caffeine boost it provides. Iowa is the only state where the majority of respondents say caffeine is the main reason they drink coffee.
- The latest time during the day Americans will drink coffee is about 2:15 PM. The state that will drink it the latest in the day is Missouri, where people will drink it until 3:36 PM, on average. Those in Tennessee stop drinking it the earliest –– they stop at 12:55 PM on average.
- 62% of Americans drink the same coffee every single day, and 37% switch up their coffee flavors and types regularly.
- The most common additives Americans put in their coffee are coffee creamer (35%), whole milk (16%), and half and half (13%).
- When adding flavors to their coffee, Americans would most often opt for vanilla (31%), caramel (16%), and hazelnut (14%).
- The average American drinks 1.9 cups of coffee per day. People from Delaware drink the most at a reported 2.2 cups per day, while people in Hawaii drink the fewest at just 1.5 cups.
The Coffee Preferences of Every State
Coffee connoisseurs can be very particular about their coffee, especially if they are from a different part of the country. Whether you’re wondering how to make a stellar brew for your out-of-state loved ones or haven’t perfected your mug yet, this table reveals all there is to know about each state’s coffee preferences.
Click the column headers to find out your state’s preferred shade, quantity of cream and sugar, cups per day, and more!
Closing Thoughts
No matter if you like it straight from the bean or with a milk substitution and 4 syrup flavors, we all love a cup of coffee. There’s just something so refreshing about an iced latte that keeps us ordering it even when it’s freezing outside. Similarly, a warm mug feels like a hug, even in the sweltering heat.
If there’s one thing that bonds us, it’s that we all need something comforting to help us get through life. At Coventry Direct, we provide comfort by helping folks turn the life insurance policies that they don’t need anymore into cash. Find out if you’re eligible to sell your life insurance policy today.