
In the land of opportunity, the American Dream still feels out of reach for many. Americans are no strangers to income inequality in many parts of the country. But how do these income gaps impact internal migration?
Are Americans moving to areas with less income inequality in search of upward mobility and a better quality of life for themselves and their families? We wanted to find out.
We analyzed income inequality ratings and moving data for major U.S Cities and drew comparisons between them to see if people are moving to find smaller gaps. Read on to see what we found.
Methodology
In order to evaluate income equality in cities around the U.S., we analyzed the Gini Index, as collected by the U.S. Census. The Gini Index is a metric used to determine income distribution across a given population. The Gini Index is on a scale from zero to one, with a lower score representing the most equality. A value of zero indicates perfect equality (every person within the population having the same income), while a value of one indicates perfect inequality (one person making all of the money, while the rest of the population makes none).
After collecting the Gini Index score for the 50 most populous U.S. cities, we then wanted to dig deeper into the migration patterns within the most and least equitable cities. We turned to the Census’ migration patterns to identify where residents of each city live before and after. We specifically isolated where people moved from to live in the most equitable cities. Conversely, we looked at where people moved after living in the most inequitable cities.
This data was collected in March 2023.
The U.S. Cities with the HighestIncome Equality
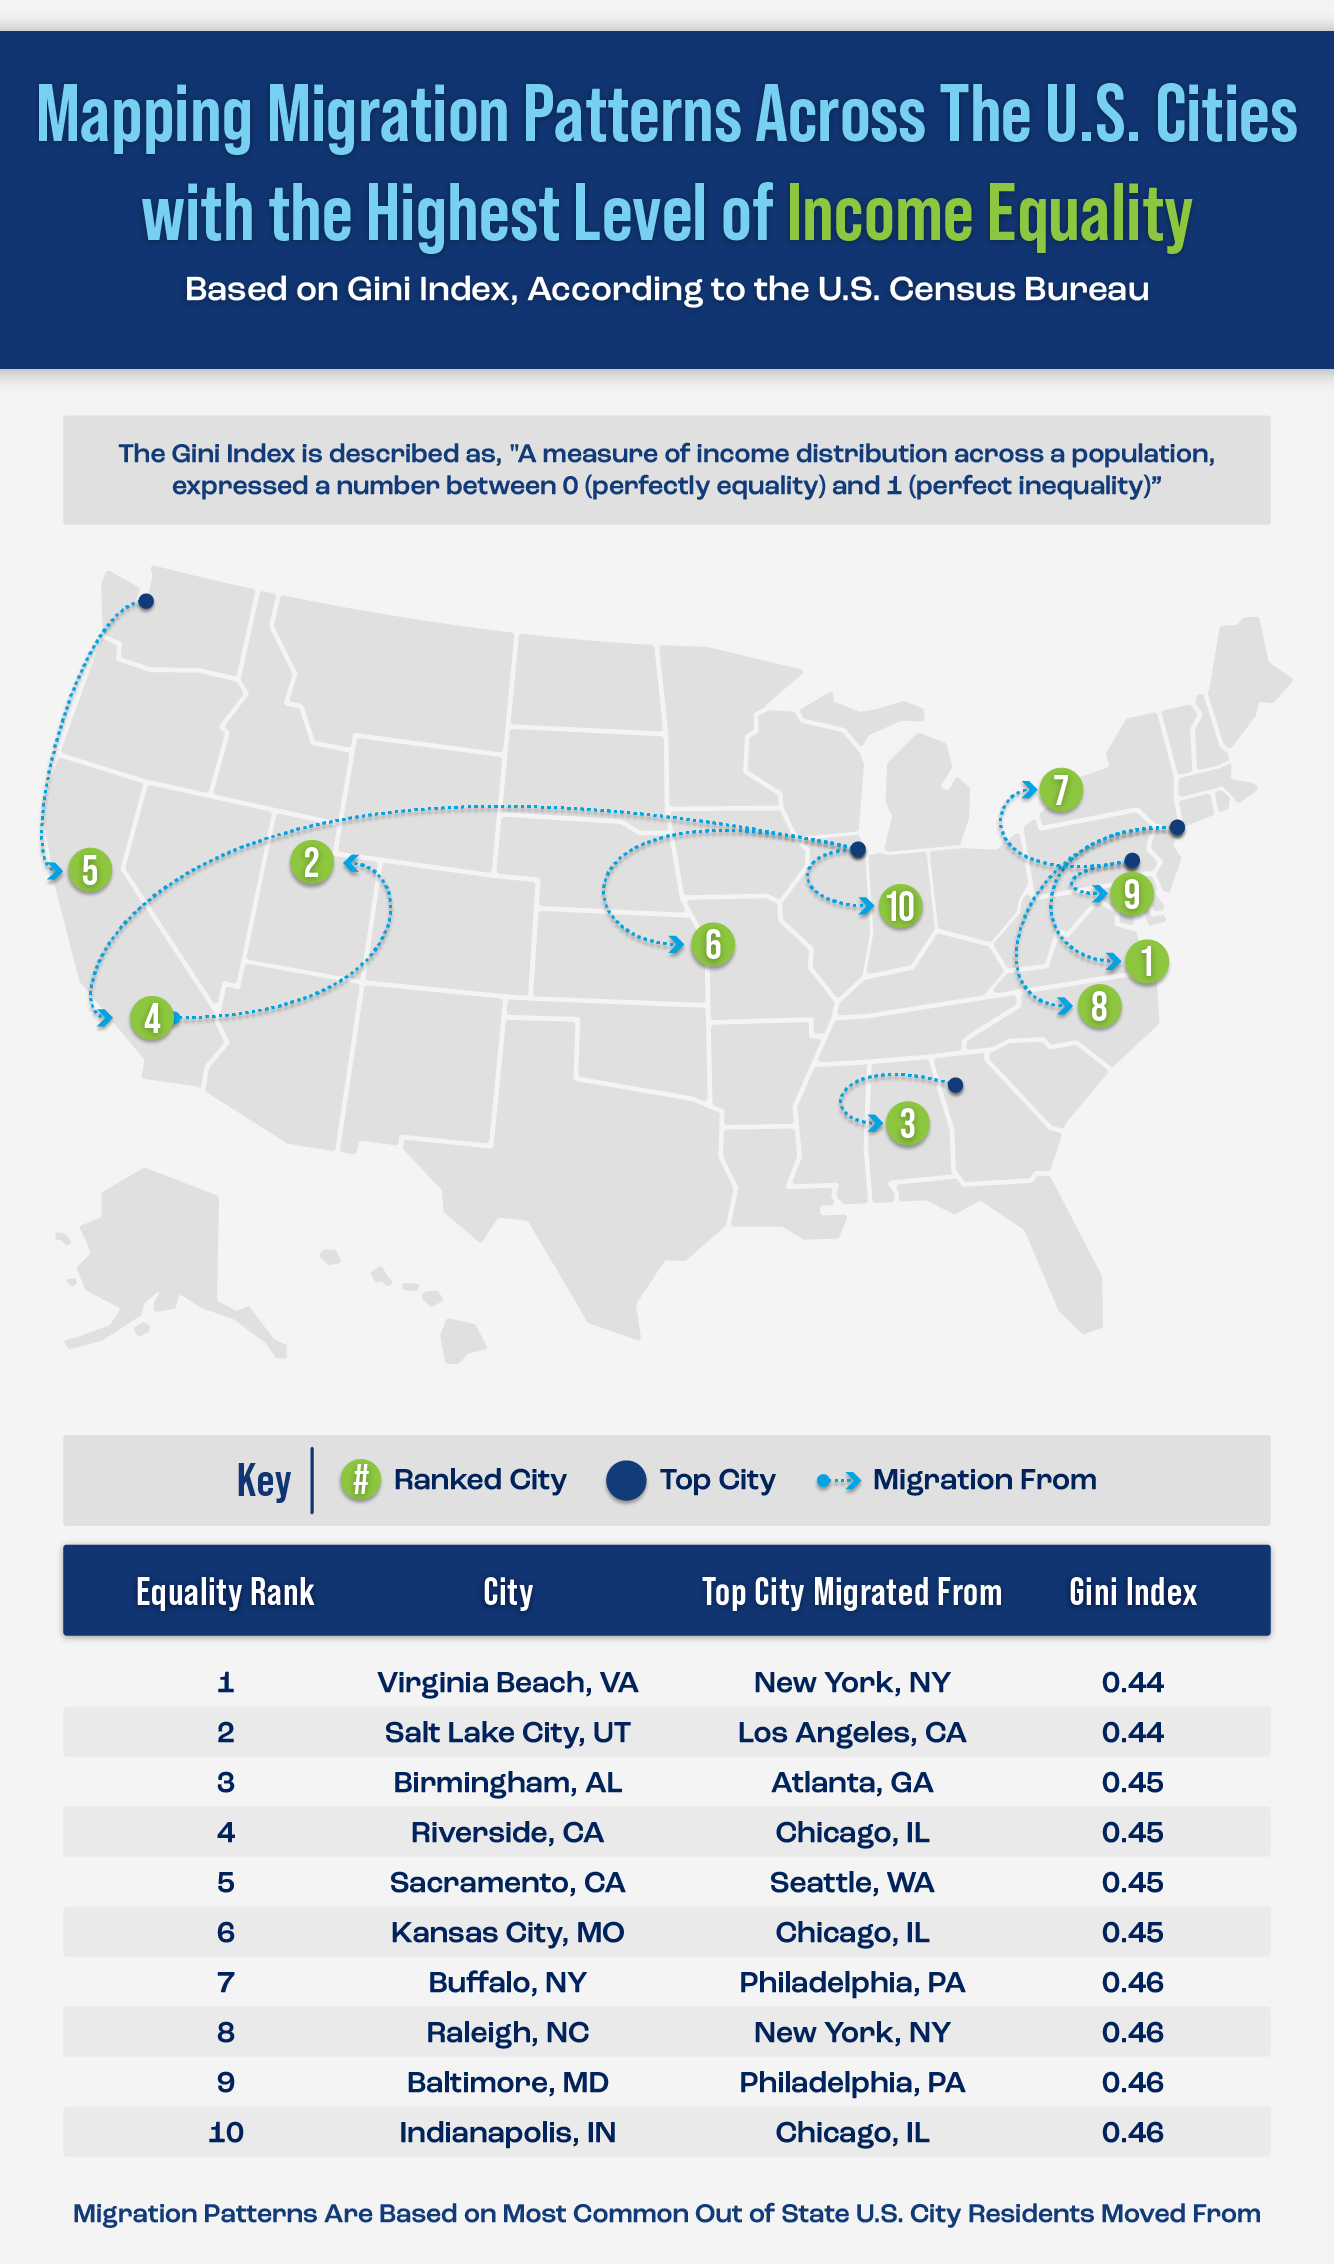
Let’s begin with the cities that achieve the most significant income equality in the U.S. To measure income equality, we used the Gini index. Developed by Italian statistician Corrado Gini, the Gini index measures statistical inequality in populations by determining values between zero (perfectly equal) and one (perfectly unequal). The calculation involves comparing the actual distribution of income or wealth with a hypothetical scenario where everyone has an equal share.
Globally .50 marks the midpoint between absolute inequality and perfect equality. For example, according to the Word Bank, South Africa has the highest income inequality globally, with a value of .63. Many countries with strong income equality score between .23 – .26. Overall, the United States as a country has a Gini index of .41, which is high compared to other developed economies.
Our map shows the 10 U.S. cities with the most income equality and the cities the most residents migrated from to move there. For example, Virginia Beach is the most income-equal U.S. city. The most common city Virginia Beach residents migrated from (beyond those that moved from elsewhere within the state) is New York, NY. At 362 miles apart, the cities aren’t exactly neighbors, illustrating how far people are willing to travel for a better chance at prosperity.
Similarly, Americans demonstrate the same willingness to migrate to Salt Lake City, the 2nd most income-equal city, from Los Angeles (a journey of 688 miles). Moving from a coastal city of over 4 million to an arid mountain city of 200,000 is a significant change, but the data indicates that for many people, it may be worth it.
The move from Seattle to Sacramento (the 5th most income-equal U.S. city) is even further at over 750 miles. This migration represents another massive climate shift Americans willingly take on to seek more equitable income opportunities.
The U.S. Cities with the Lowest Level of Income Equality
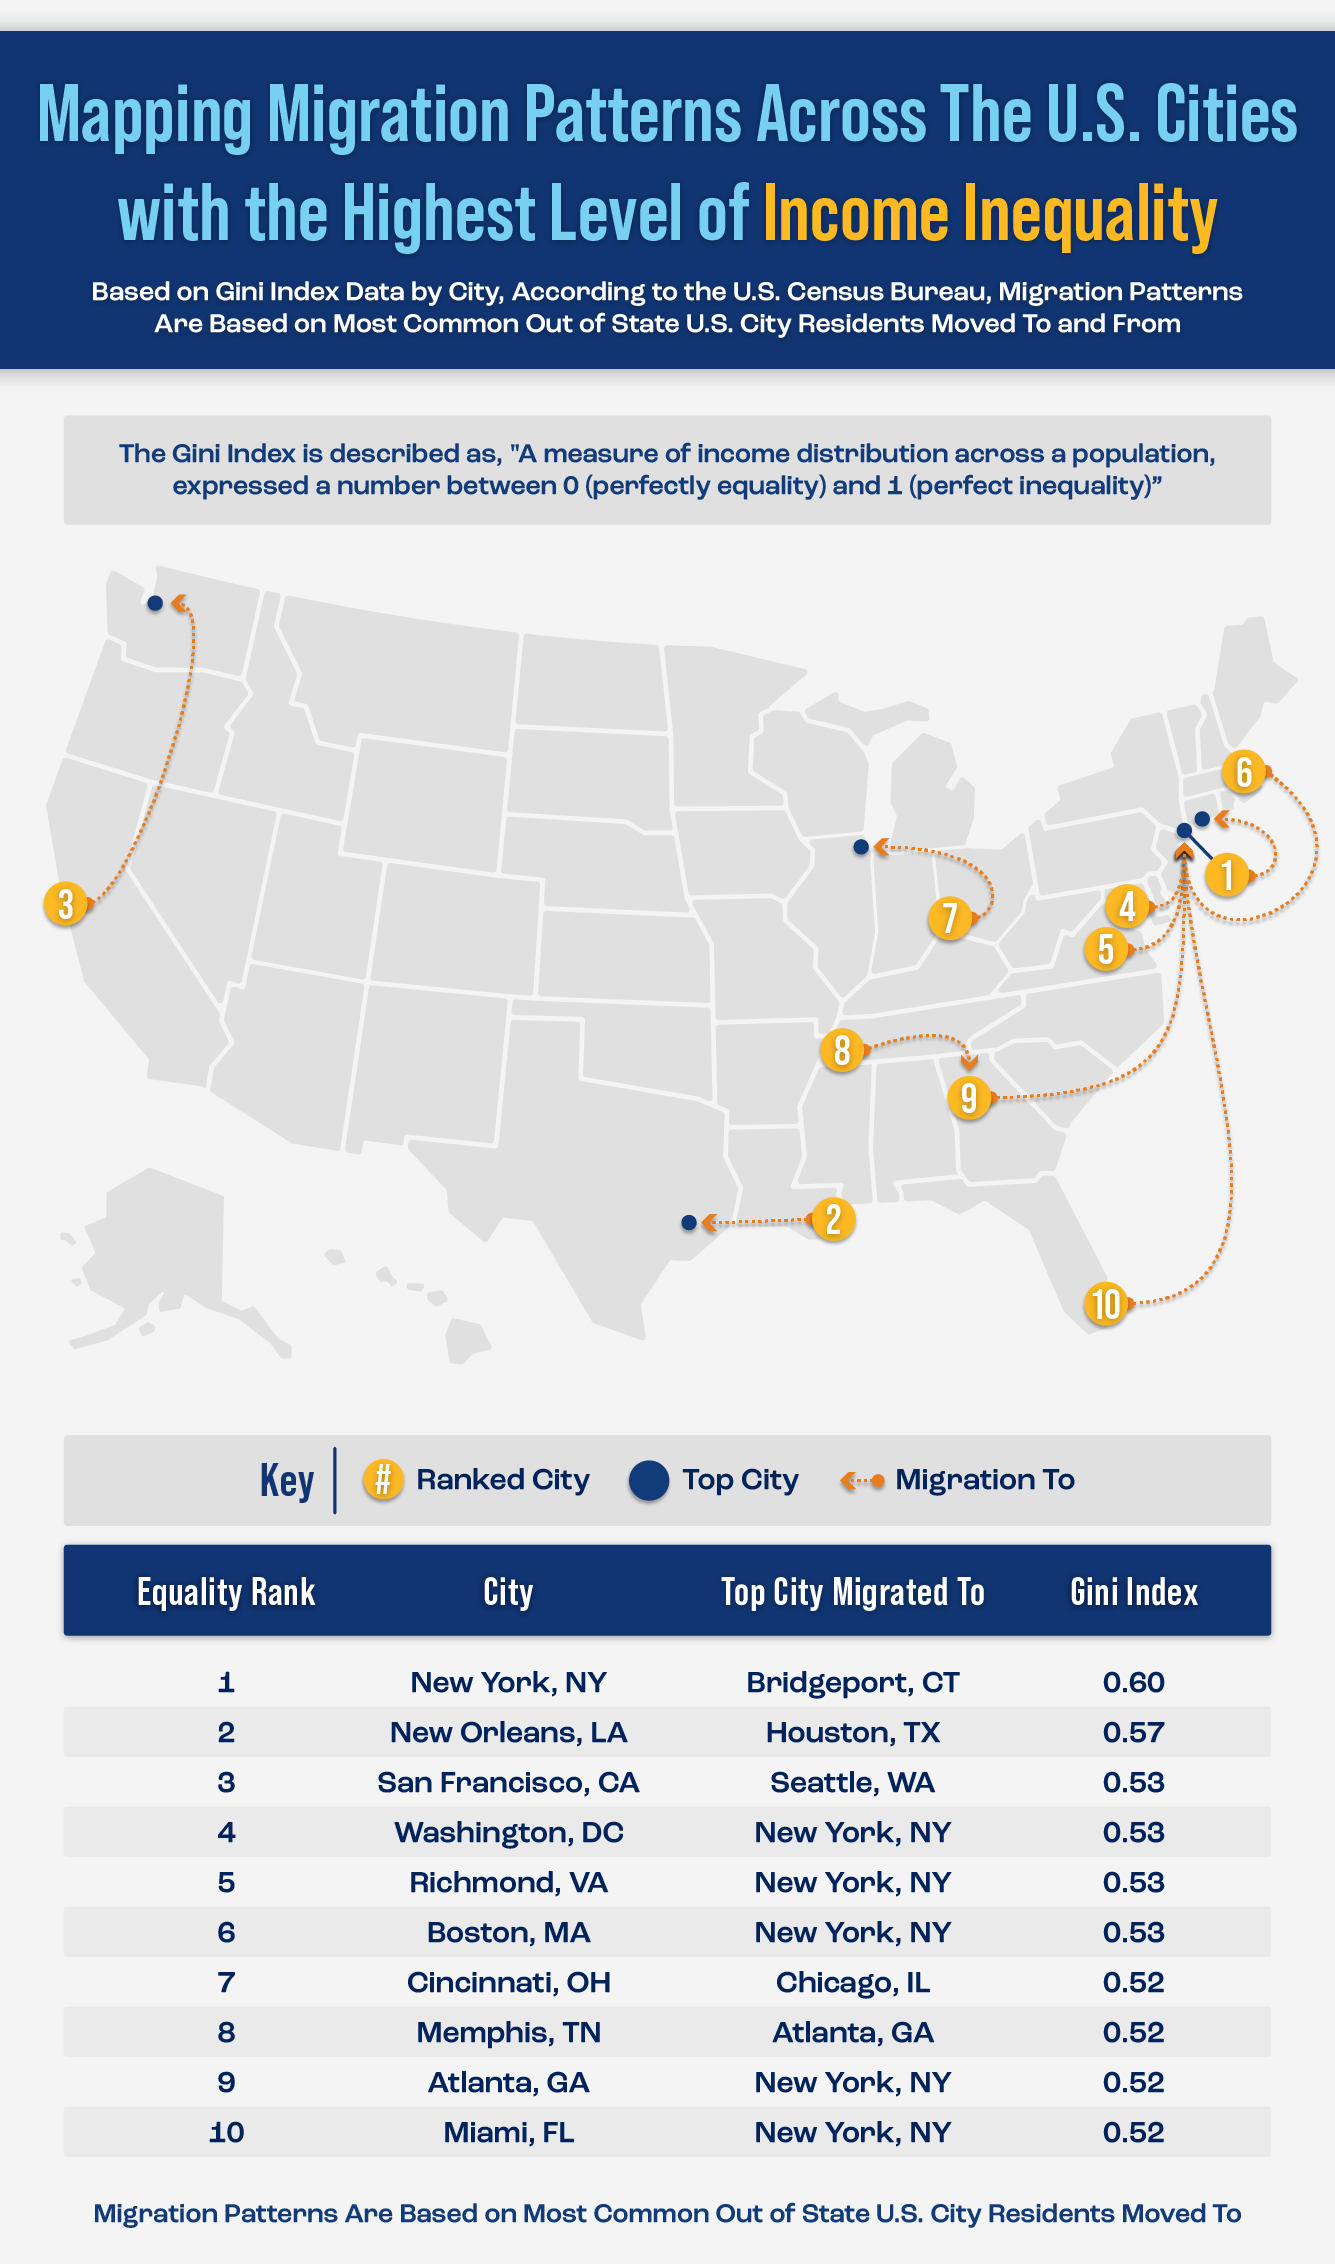
Next, we wanted to highlight 10 U.S. cities with the highest levels of income inequality. Again, there’s a trend of Americans moving from areas with high-income inequality to places with more even wealth distribution.
Americans living in the lowest-ranking U.S. city for income equality, New York, NY, frequently migrate over 60 miles to the more equal city of Bridgeport, CT. While not perfectly equal, Bridgeport has a slightly better income equality score of 0.54, compared to NYC’s 0.60.
Similarly, San Franciscans make the 800-mile journey to Seattle for a more even distribution of wealth. You may recall that others were leaving Seattle to go to more equitable places like Sacramento. With an equality rank of 27 of the 50 most populous cities, Seattle creates an environment where some residents stay and others leave.
On the other hand, Miami and Atlanta residents travel 1,275 and 862 miles to New York, NY, proving that income equality is not the end all be all when it comes to deciding where to live.
Closing Thoughts
Overall, while there are many factors taken into consideration when people decide to move, equality (or inequality) is certainly one of them for many.
At >Coventry, we believe everyone should have the opportunity to achieve their financial goals. As such, we are proud to offer support in accessing the hidden value of life insurance policies. Contact us today for more information.