
Retirement doesn’t mean the end of income for most people, as things like Social Security, pension plans,and reverse mortgages still provide a flow of funds for many when they leave the workforce for good. Of course, retirement income differs from person to person based on all kinds of factors, including their previous career, the aggressiveness of their investments, and even where they live.
That last point, how retirement income differs by location, is one that our team here at Coventry Direct wanted to explore. Thankfully, the United States Census Bureau releases data on this topic annually, cataloguing things like how many homes receive retirement income, average amounts brought in, and more. Our team was able to take the newest information the census has released, which covers 2019, and use it as the basis for a full breakdown of what retirement income looks like in every state in the most recent year for which we have data, which you can see below!
First, we took the overall total in every state and divided it by Census totals for the number of homes in each state that actually receive retirement income. When examined this way we found that retirees in Washington, D.C. brought in the most retirement income per household in 2019, with an average of $43,601. That is the only place in the country that topped the $40,000 mark, though one of the most sparsely populated states, Alaska, came close with an average of $39,214. Maryland, California, and Virginia round out the top five when ranked this way, all bringing in an average household retirement income amount at least 17% higher than the national average of $28,381.
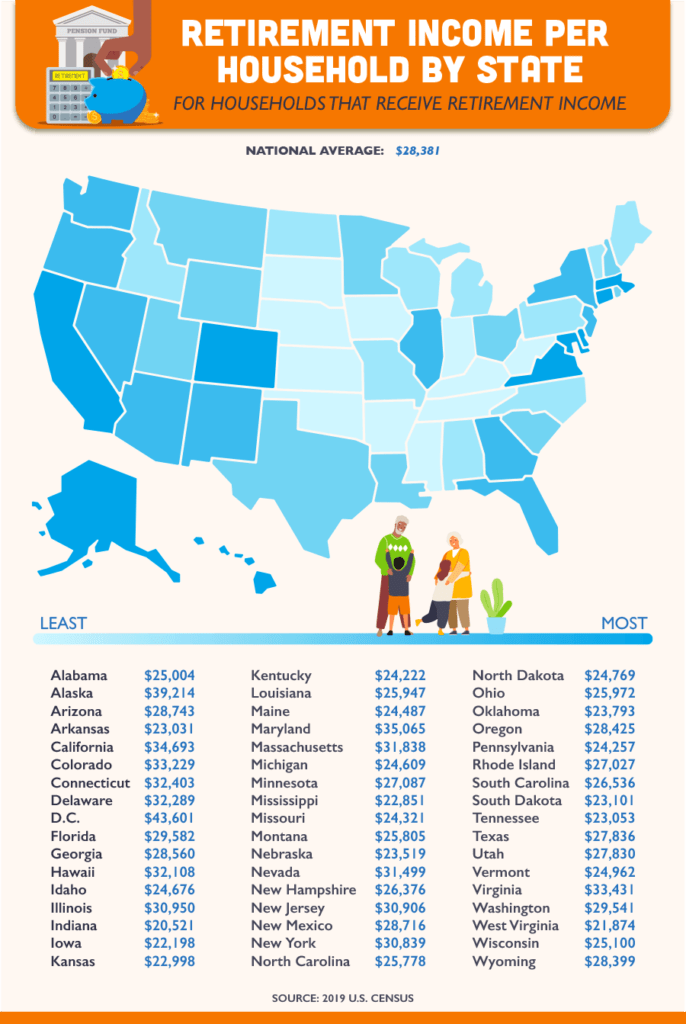
On the opposite end of the spectrum, Indiana finished last in the country, with retired Hoosiers only receiving $20,521 per household, nearly 28% below the national average. West Virginia, Iowa, Mississippi, and Kansas are the remaining states in the bottom five of this metric.
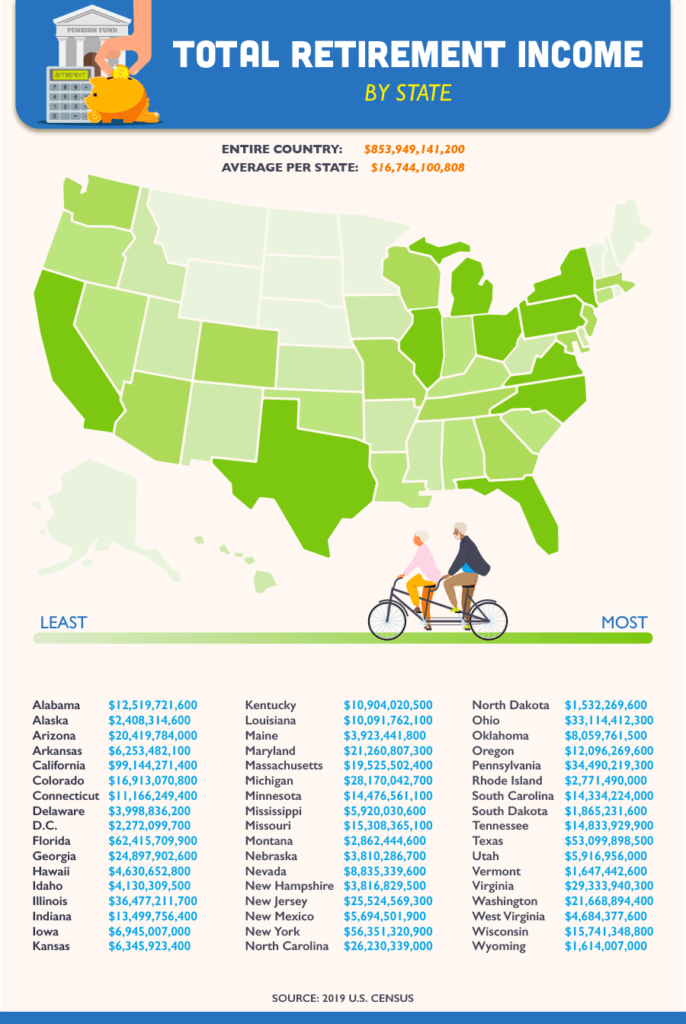
Next, we wanted to examine how much total income retirees in every state were receiving. All told, retirees in 2019 received over $850 BILLION in income, averaging over $16.7 billion per state. We found the exact amount retirees brought in on a state-by-state basis and mapped out the results, which can be seen above. Unsurprisingly, more populated states like California, Florida, and New York lead the way, with California finishing at the top with almost $100 billion all by themselves, well clear of second-place Florida’s $62 billion!
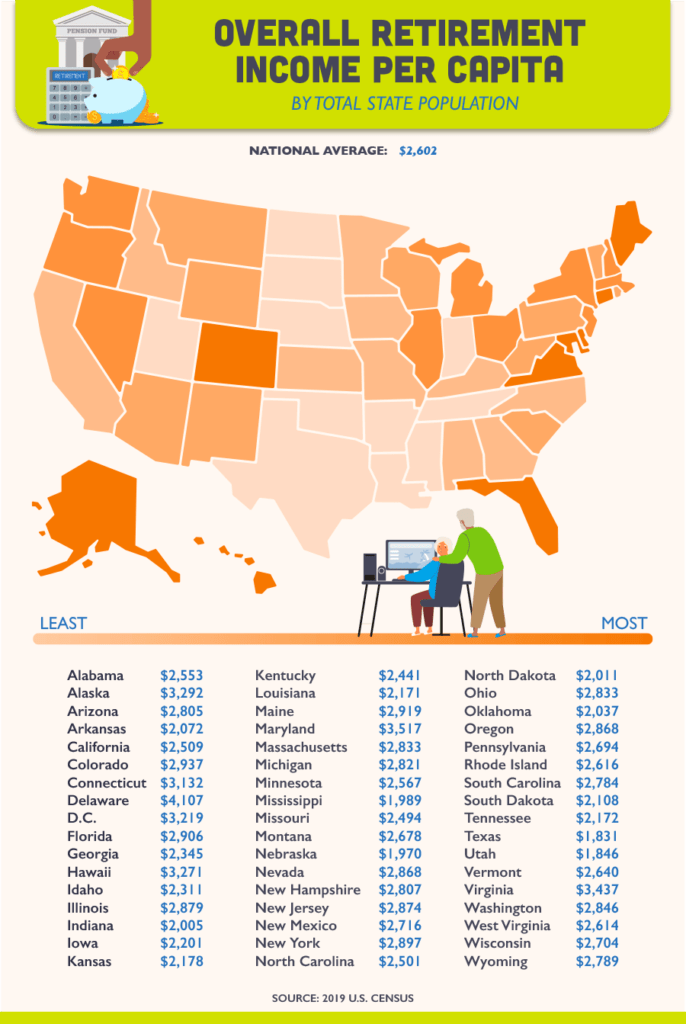
Finally, we wanted to see how much retirement income is flowing into each state based on the overall population, not just those living in households that received retirement income. Across the entire country there was an average of $2,602 in retirement income distributed for every citizen in 2019.
When examining the top performing states when evaluating the data this way, Delaware is far and away the biggest winner, with over $4,100 per person in retirement income brought in, a total that is over $500 greater than Maryland in second place. Comparatively, there are seven different states where less than half that amount of retirement income was brought in per person, with Texas’ $1,831 being the lowest amount in the nation.
We also looked at how different regions of the country performed when analyzed the same way as individual states were. In terms of raw totals, we found that the South received more retirement income than any other part of the country, and by a substantial amount. Southern retirees received nearly $100 trillion more than the next closest region, which was the West.
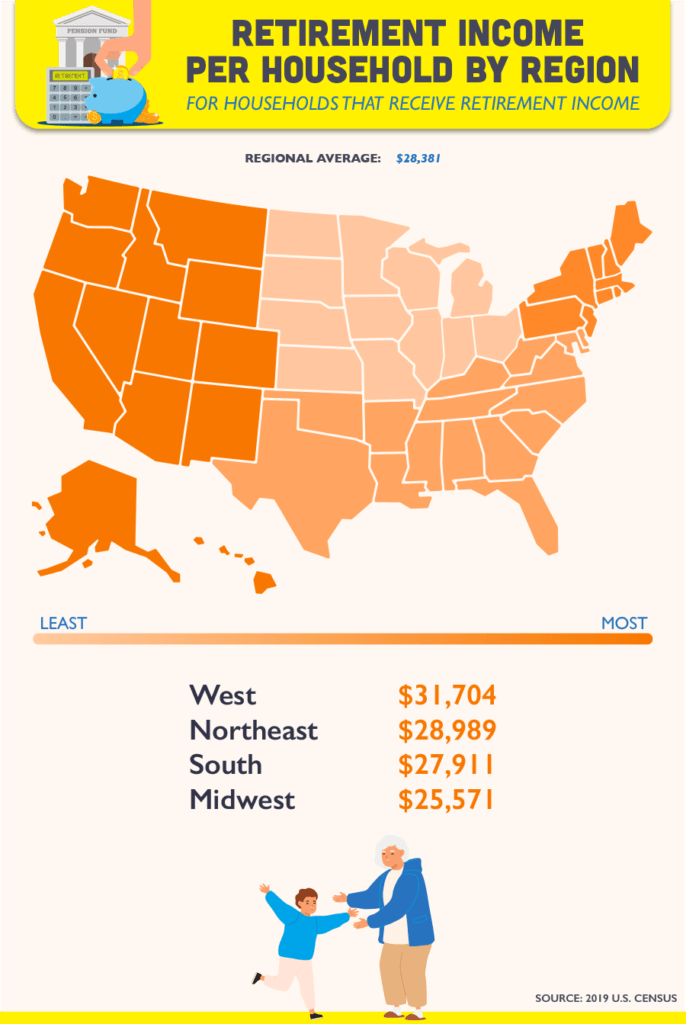
Again, however, the picture shifts when examined on a per capita basis. When adjusted to find the per capita totals based on the number of households with retirement income, both the West and the Northeast regions of the country leapfrog the South. However, in both of these first two evaluations the Midwest finishes last.
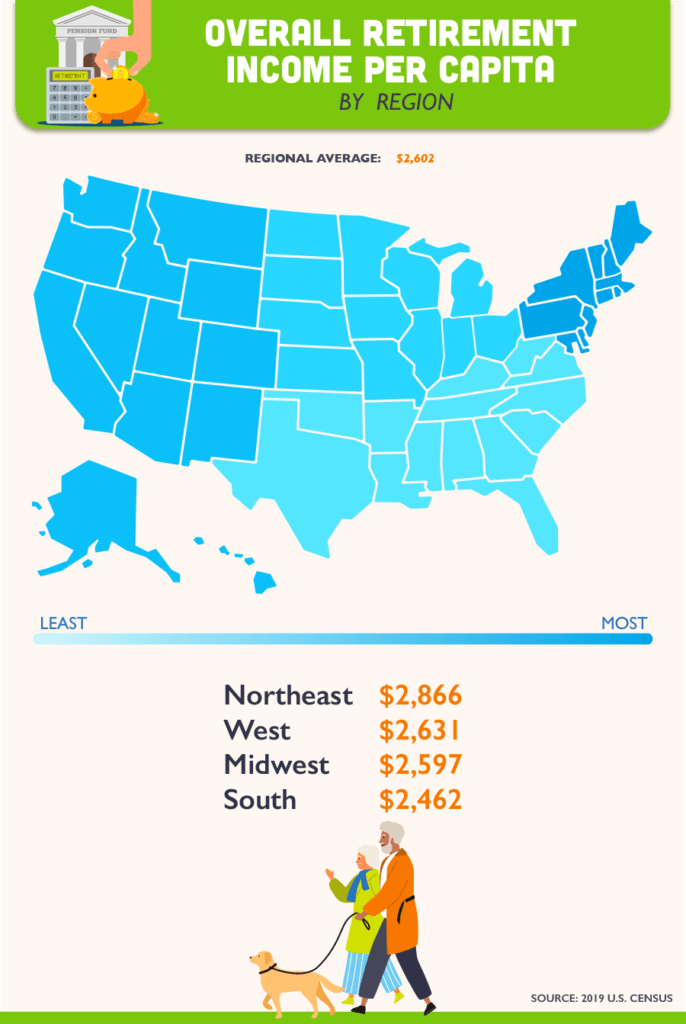
On a total population basis, however, the Midwest is also able to top the South, moving up to third place. There is also further change at the top of the list, with the Northeast taking the number one spot and the West sliding to second.
Of course, geography is just one of many factors that impact what an individual’s retirement income looks like, but it is also one of the ones that is easiest to analyze. Different laws, the prevalence of different industries and unions, and so much more go into explaining why the results we examined above came out the way that they did, and we hope that anyone interested in exploring this topic further can use our research as a jumping off point to dive even deeper. And if you are a retiree looking to boost your own income now that you are no longer working, the experts at Coventry Direct are here to help you explore your options, including the possibility of selling your life insurance policy!
Source: United States Census Bureau- https://www.census.gov/